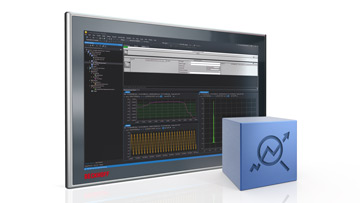
The TwinCAT 3 Analytics Workbench is a TwinCAT 3 engineering product for creating continuous data analyses. The data can come from various applications such as machines, buildings, or energy systems, for example. The configuration of the workbench is integrated into Microsoft Visual Studio and is designed as a graphical user interface. Many algorithms for configuring the analysis are available in a toolbox:
- cycle time monitoring
- statistics (min/max/avg, standard deviation, OEE, etc.)
- correlation functions
- regressions
- digital filter functions
- frequency analyses/order analyses
- evaluation of harmonics in the network
- image data processing
- weight measurement
- and others
For simple visualization of the signal curves, the TwinCAT 3 Analytics Workbench contains the TE1300 TwinCAT 3 Scope View Professional: the user can drag and drop the analysis results from the Analytics Configurator into the charting tool to mark significant points in the data stream. These markings can be simple minima and maxima, counter values or also the results of a logic operator that logically combines events from the machine controller so that they can be found in the data stream. This allows correlation with other signals in the Scope View to the exact cycle.
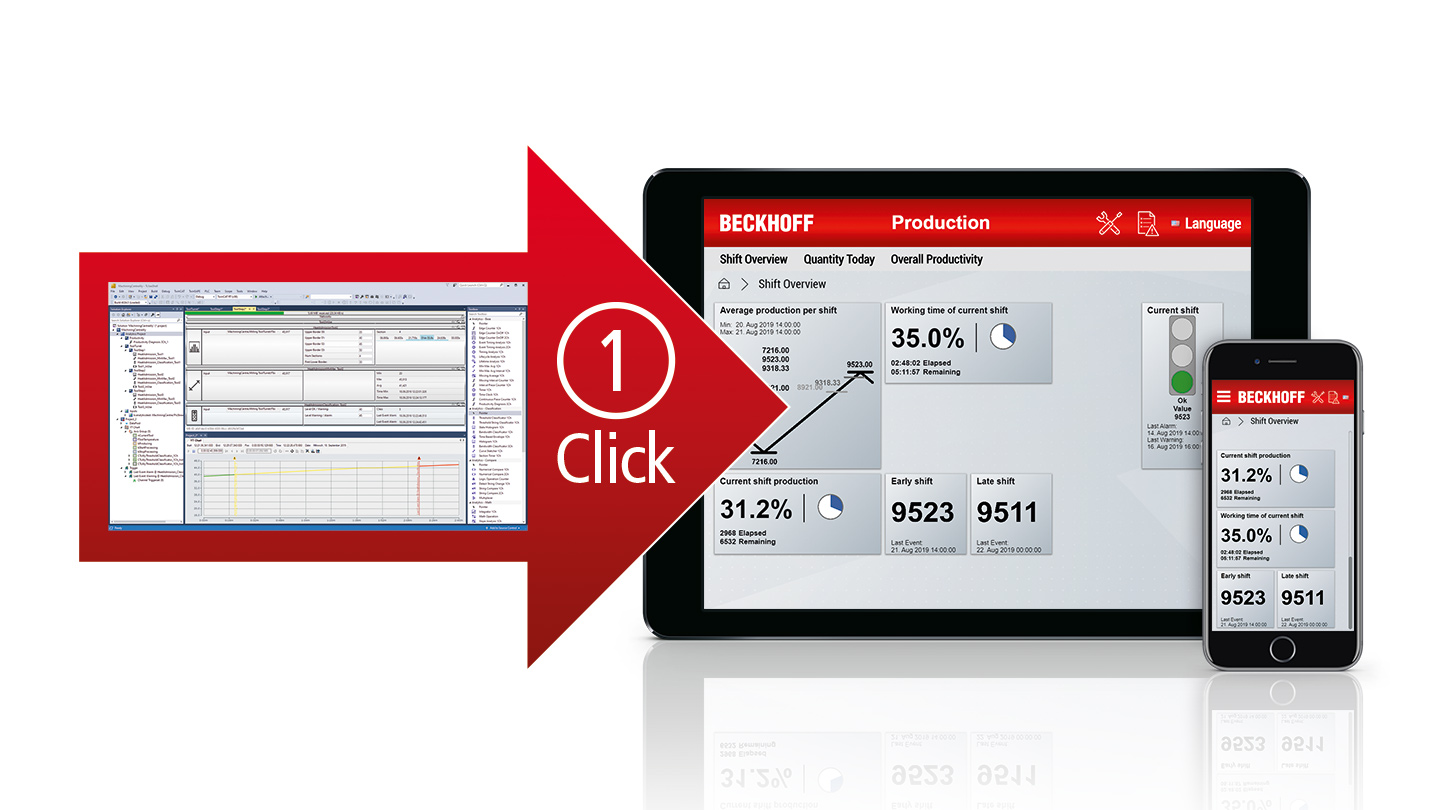
If the created analysis is complete and has been tested in the graphic editor, this configuration can be converted into readable PLC code and an HTML5-based dashboard with just one click. Both can be downloaded directly to the TF3550 TwinCAT 3 Analytics Runtime, where they can run 24/7 in parallel with the actual production machine and supply analysis results. The transparent PLC and HMI projects can be customized with all TwinCAT standard functions to create the ideal display for machine operators, production managers, and machine builders.
Product licenses already included:
The functionalities of the Workbench are also included in the products of the TE351x series. However, rather than working with the full range of algorithms, these products are specifically intended for certain groups of algorithms – for vision, condition monitoring, or energy data evaluation, for example. Further information can be found on the TwinCAT Analytics highlights page and on the measurement and testing technology industry page.
Product status:
regular delivery
© Beckhoff Automation 2025 - Terms of Use


